
The regulatory landscape is shifting fast. By 2025, over 2,000 companies must comply with the EU's Corporate Sustainability Reporting Directive (CSRD), requiring detailed ESG disclosures across their operations. This isn't just a compliance checkbox—it's fundamentally changing how organizations track and report their environmental impact.
Here's the problem: most marketing teams manage between 50,000 to 200,000 digital assets without any sustainability tracking. Every image, video, and document has a carbon footprint from creation to storage to distribution, but this data lives in silos. Your creative team uploads 500 product photos to the DAM system, but there's no record of their energy consumption, storage requirements, or lifecycle impact.
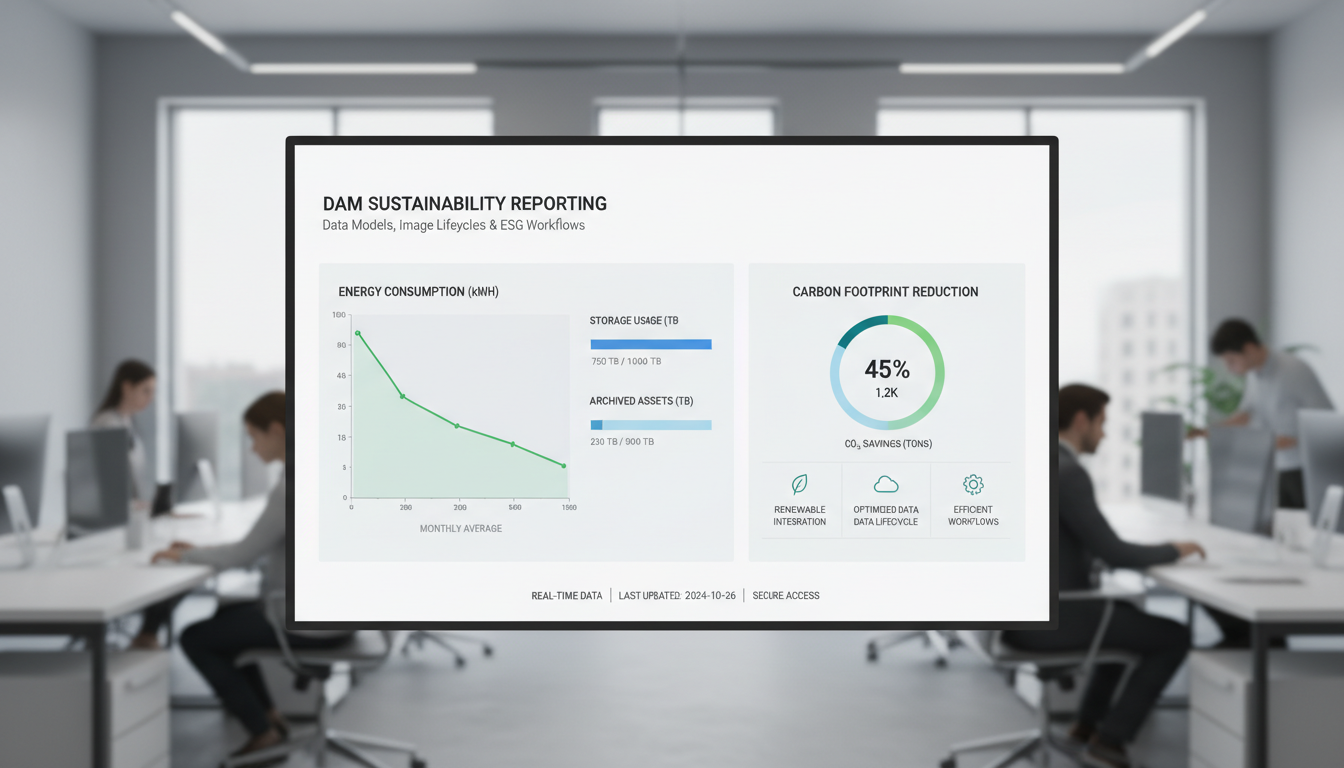
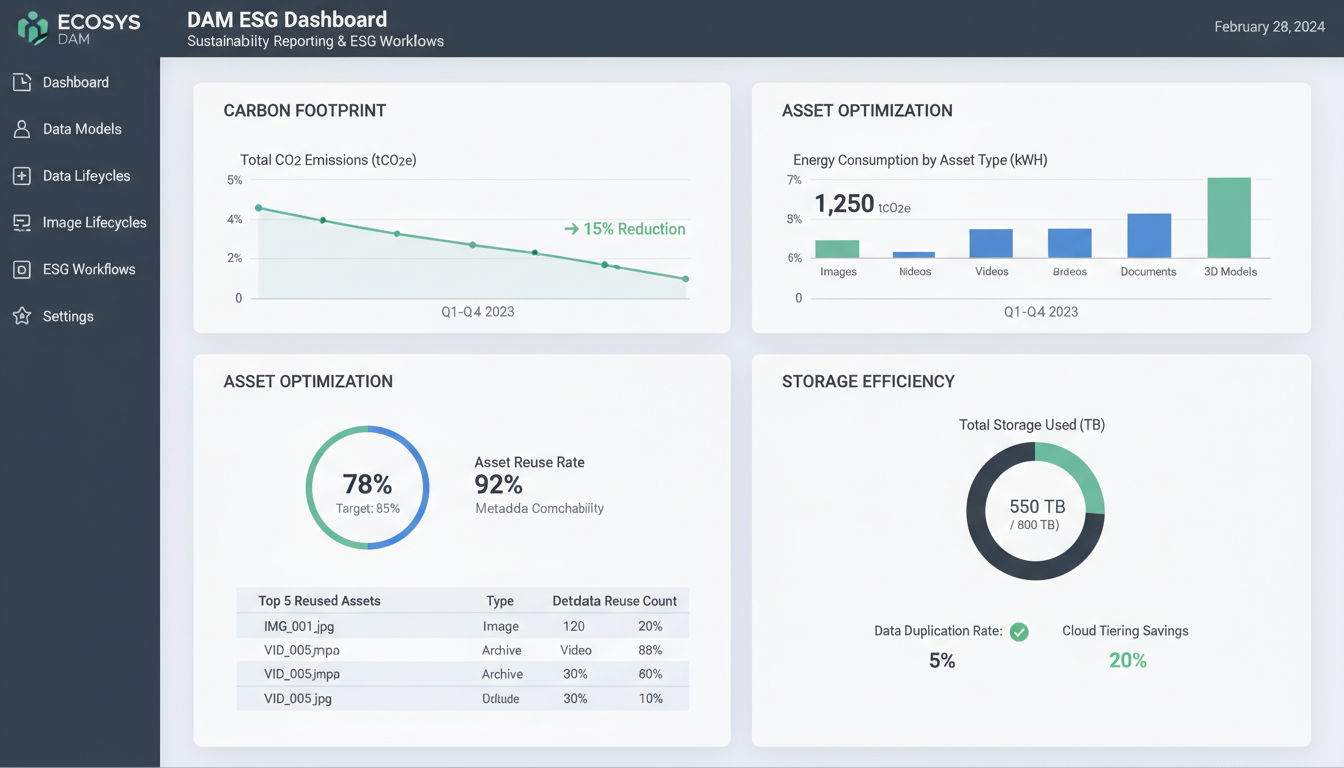
DAM ESG integration solves this blind spot by embedding sustainability metrics directly into your digital asset lifecycle. Instead of scrambling to collect ESG data at year-end, modern DAM systems can automatically track energy usage, storage efficiency, and asset optimization rates in real-time.
Consider a retail company with 75,000 product images. Without DAM sustainability reporting capabilities, they can't answer basic questions: Which assets consume the most server energy? How much storage waste comes from duplicate files? What's the carbon impact of their content distribution network?
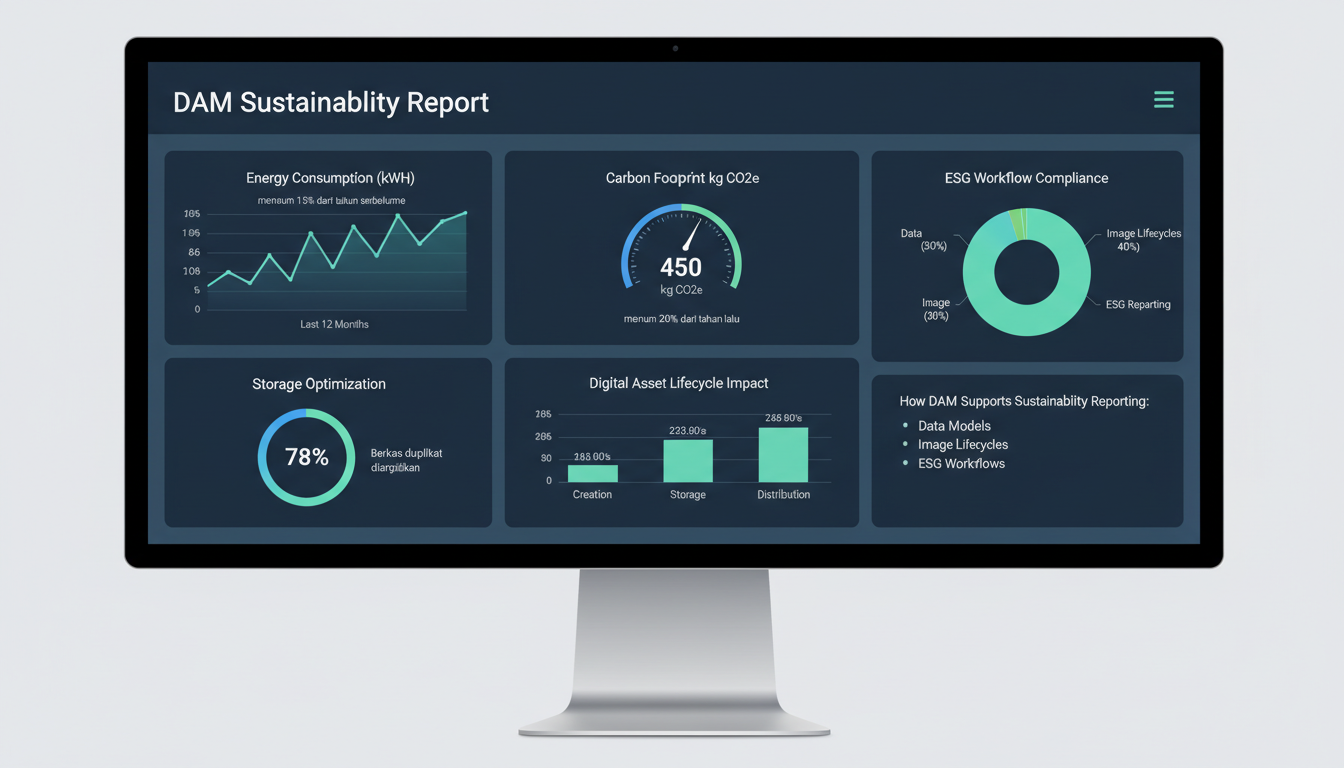
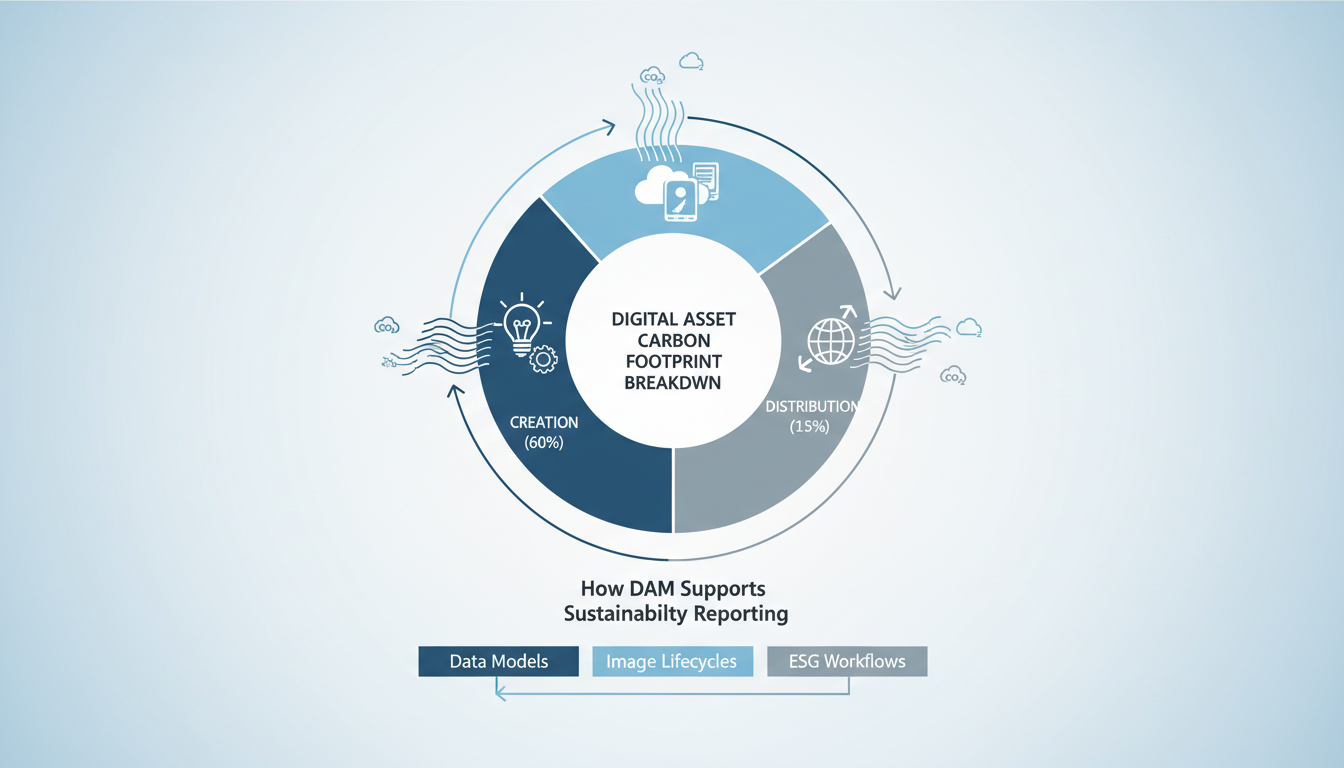
The solution involves three core components: data models that capture sustainability metrics at the asset level, automated lifecycle tracking that monitors energy usage from upload to deletion, and ESG workflows that integrate with existing reporting systems.
This approach transforms your DAM from a simple storage solution into a sustainability intelligence platform. Marketing ops teams can finally provide concrete data for ESG reports while simultaneously optimizing their digital operations for better environmental performance.
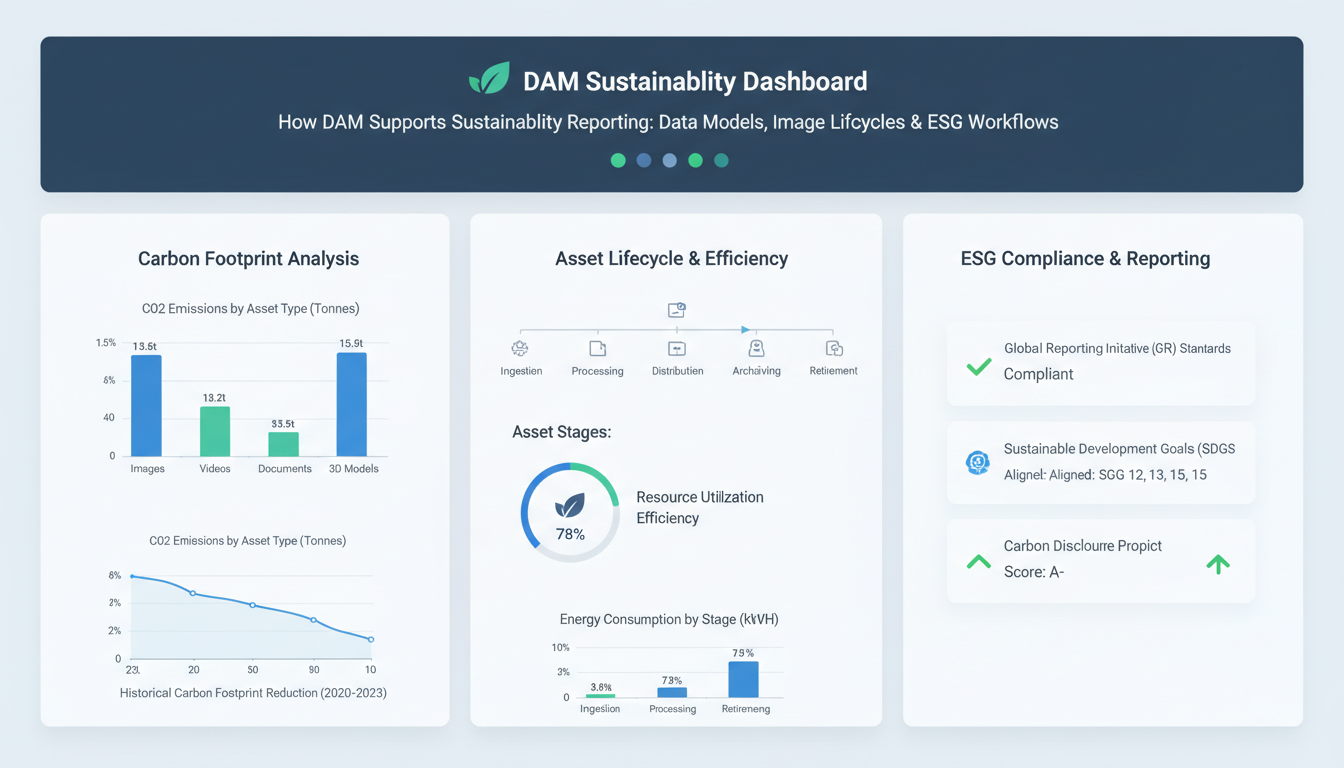
Modern DAM ESG integration requires precise alignment with established reporting standards. GRI 302 (Energy) and GRI 305 (Emissions) now explicitly include digital content consumption metrics. This means tracking energy usage from asset creation through distribution and storage.
For media companies, SASB requirements demand granular asset tracking throughout production cycles. A typical video campaign generates 40-60GB of raw footage, creating measurable environmental impact through cloud storage and processing power. DAM systems can automatically log these metrics during upload and conversion workflows.
Scope 3 Emissions: The Hidden Digital Footprint
Digital assets represent 15-25% of most corporations' total carbon footprint—a figure many sustainability teams overlook. Consider this breakdown:
EU Taxonomy alignment for digital transformation requires documenting how DAM systems reduce environmental impact. Smart asset lifecycle management can cut storage needs by 30-40% through automated compression and duplicate detection.
Practical Measurement Strategies
Track these specific sustainability reporting metrics within your DAM:
Leading organizations like Unilever now report digital asset carbon intensity alongside traditional emissions data. Their DAM system automatically calculates environmental cost per campaign asset, feeding directly into quarterly ESG reports.
This data integration transforms DAM from a storage solution into an active sustainability reporting tool, providing auditable metrics for regulatory compliance.
Data centers consume 1% of global electricity just for asset storage, making DAM ESG reporting more than a compliance exercise—it's an environmental imperative. Every digital asset carries a measurable carbon footprint throughout its lifecycle.
Consider the numbers. A 10GB video file generates 0.0036 kg CO2 per hour of storage. That seems minimal until you scale it across enterprise libraries. Image processing adds another layer: converting a RAW file to web-ready formats consumes 0.12 kWh per 100MB file. For creative teams processing hundreds of assets daily, this energy cost accumulates fast.
Distribution creates the largest impact spike. Transferring 1TB of data generates 0.5 kg CO2 emissions—equivalent to driving 1.2 miles in an average car. When marketing teams distribute high-resolution campaign assets globally, these emissions multiply across every download, preview, and share.
Lifecycle Emissions Breakdown:
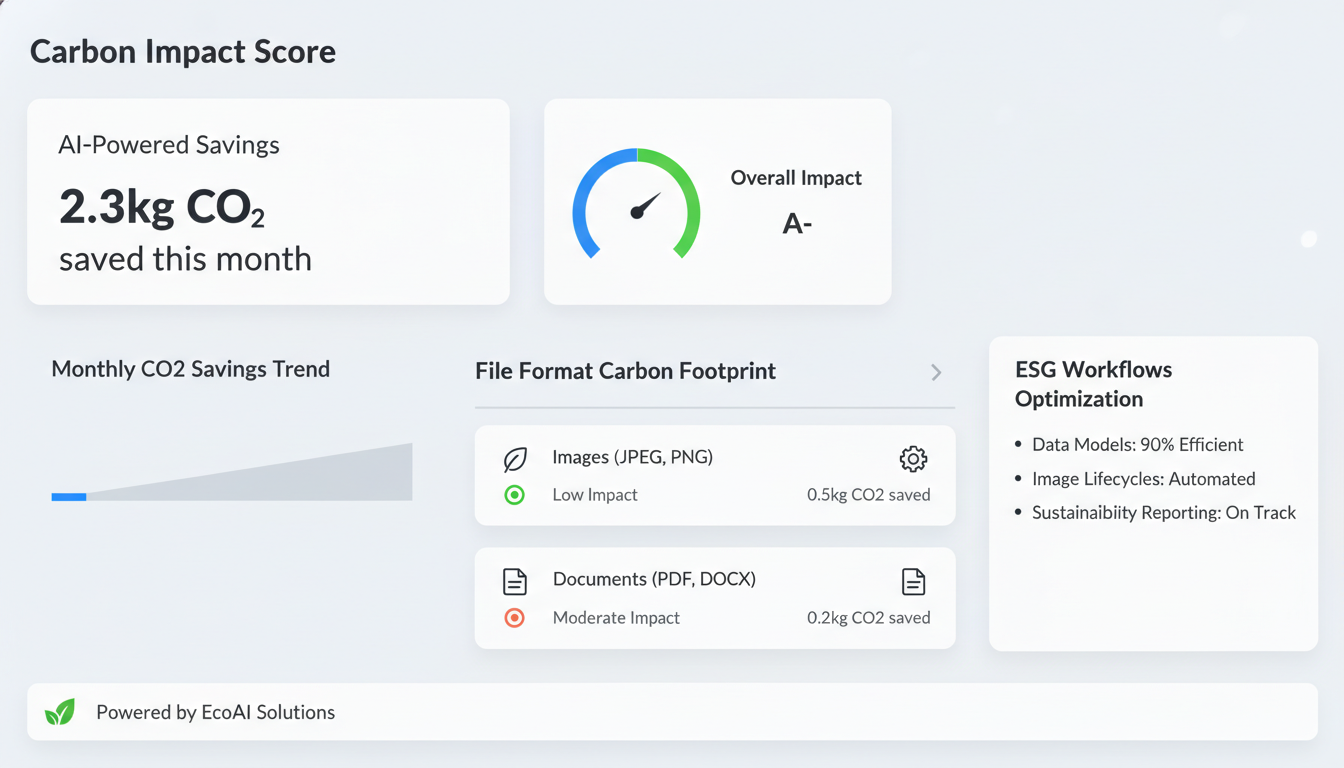
Real-world impact becomes clear with concrete scenarios. An enterprise managing 500,000 assets generates approximately 2.3 tons CO2 annually through DAM operations alone. This equals the carbon footprint of 5,100 miles of driving.
Smart DAM ESG workflows address these emissions systematically. Automated compression reduces storage requirements by 40-60% without quality loss. Intelligent CDN routing minimizes distribution distances. Archive policies automatically move unused assets to lower-energy storage tiers.
The key is measurement. Modern DAM platforms now integrate carbon tracking APIs that calculate real-time emissions per asset, enabling precise sustainability reporting. This data feeds directly into GRI 302 and GRI 305 frameworks, transforming abstract environmental goals into actionable metrics.
Stage 1: Creation Tracking Modern DAM systems now monitor production tools and energy consumption at source. Adobe Creative Cloud integrations can track rendering times—a 4K video render consuming 2.3 kWh becomes part of your ESG data model from day one.
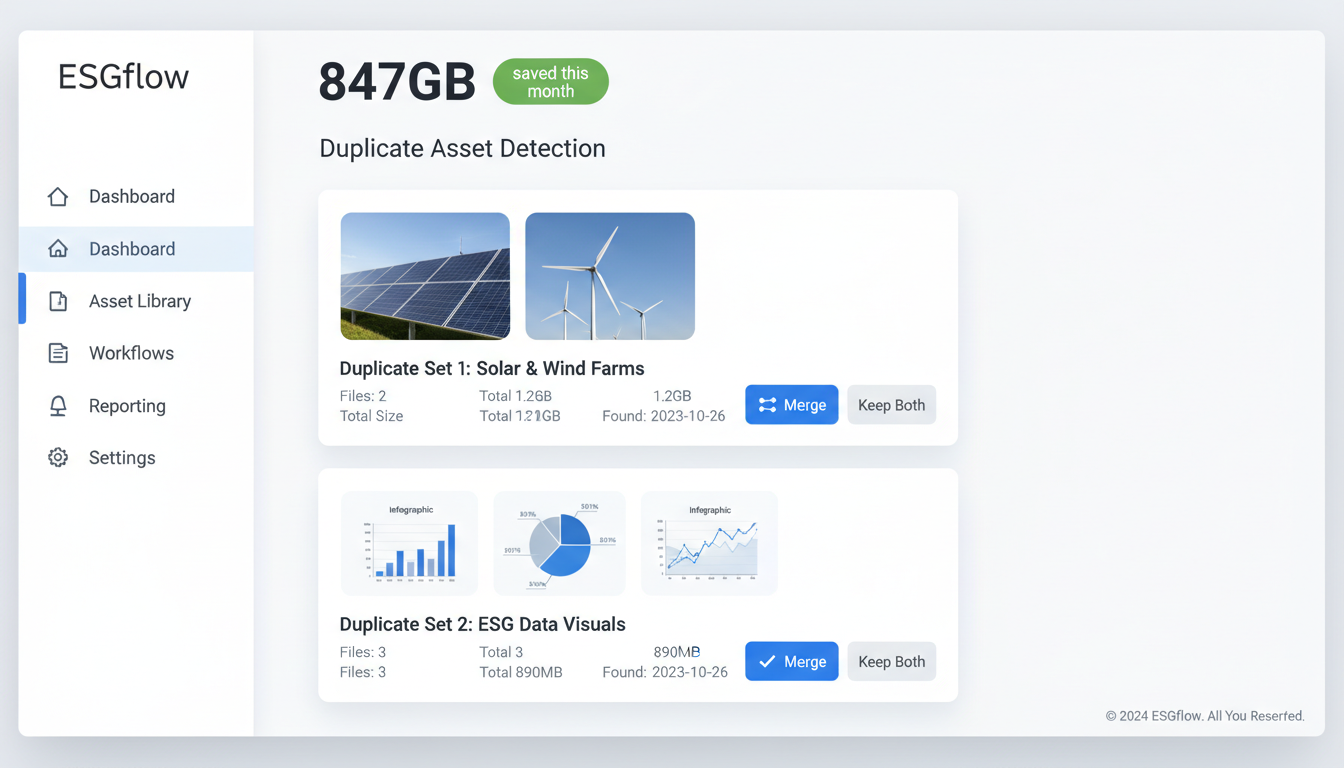
Stage 2: Smart Ingestion Duplicate detection algorithms save approximately 30% storage capacity by preventing redundant uploads. When your marketing team uploads the same product shot three times, DAM ESG workflows automatically flag and consolidate these assets.
Stage 3: Automated Processing Compression algorithms reduce file sizes by 40-60% without visible quality loss. A 12MB product photo becomes 4.8MB through intelligent optimization, cutting storage and bandwidth costs while maintaining brand standards.
Stage 4: Tiered Storage Strategy Assets move to cold storage after 90 days of inactivity. Your 2022 campaign images shift from high-performance SSD to energy-efficient archive storage, reducing per-gigabyte costs by 75%.
Stage 5: Distribution Optimization CDN smart delivery serves WebP to Chrome users, JPEG to Safari users. This format switching reduces data transfer by 25-35% compared to universal JPEG delivery.
Stage 6: Performance Analytics Usage tracking reveals which assets justify their carbon footprint. That hero banner generating 50,000 impressions monthly? Worth it. The forgotten infographic consuming storage? Time for review.
Stage 7: Automated Retirement Deletion policies eliminate unused assets after predefined periods. Companies report 25% storage cost reductions through systematic asset retirement—particularly effective for seasonal campaigns and outdated product imagery.
This lifecycle approach transforms DAM ESG reporting from reactive compliance into proactive environmental strategy, with measurable impact on both sustainability metrics and operational costs.
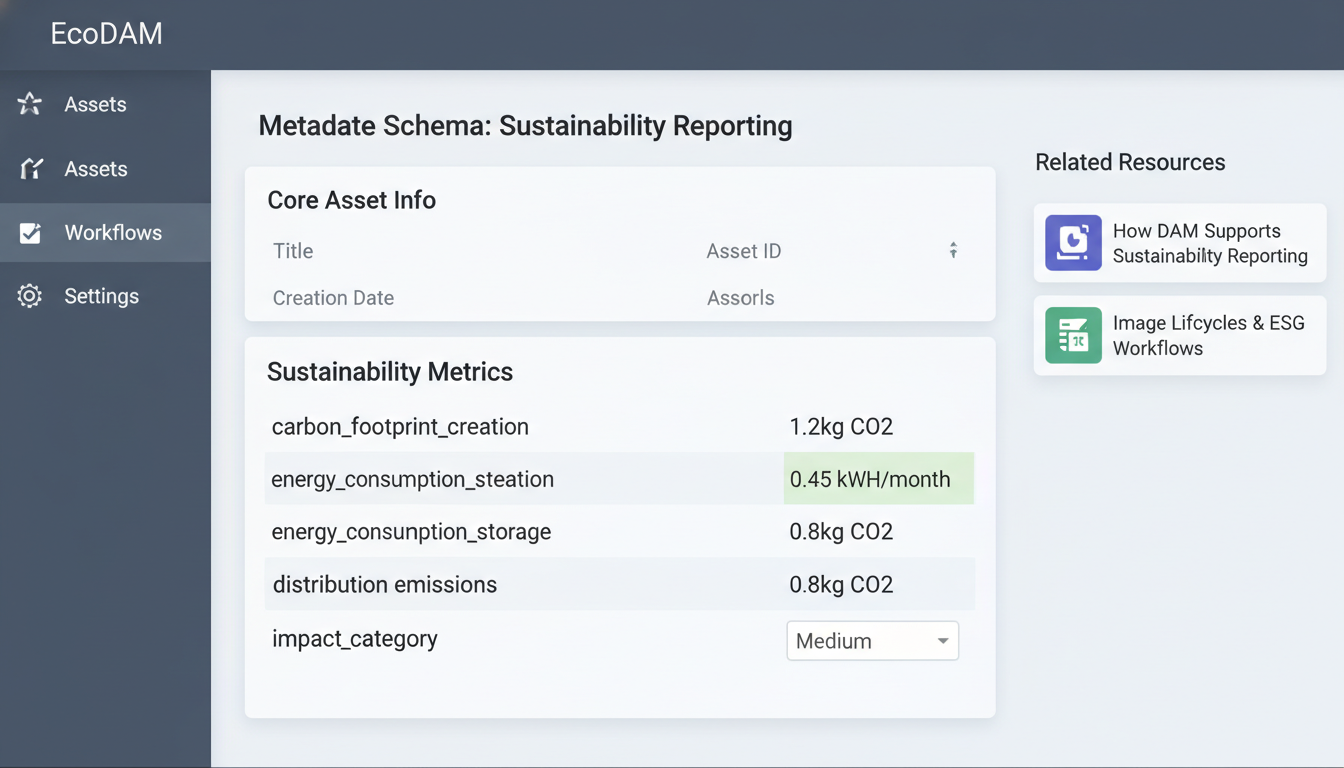
Building effective DAM ESG workflows starts with structured metadata that captures environmental impact at granular levels. Enterprise systems require 15 core sustainability fields to enable comprehensive carbon tracking across the digital asset lifecycle.
Essential metadata fields include carbon_footprint_creation (measured in CO2kg), energy_consumption_storage (kWh/month), and distribution_emissions tracking CDN delivery costs. Smart taxonomy structures categorize environmental impact using High/Medium/Low classifications—a 4K video render consuming 2.3 kWh earns "High" status, while compressed thumbnails rate "Low."
API Integration Powers Automated Tracking
Modern DAM platforms connect directly with carbon accounting tools like Watershed and Persefoni through REST APIs. These integrations pull real-time energy data from cloud providers—AWS CloudWatch metrics feed directly into asset-level carbon calculations. When you upload a 50MB video file, the system automatically queries your hosting provider's energy mix and calculates storage emissions.
AI-powered sustainability scoring eliminates manual tagging bottlenecks. Machine learning algorithms analyze file properties—resolution, codec efficiency, storage tier—then assign environmental scores. A ProRes 4K file gets flagged immediately for optimization opportunities.
Hierarchical Reporting Structure
Brand-level carbon budgets cascade down through campaign and asset tiers. Marketing teams can track that their Q3 video campaign generated 47kg CO2 across 127 assets, with 73% coming from inefficient formats. This granular visibility enables targeted optimization—converting ten large PSD files to WebP format might reduce campaign footprint by 15%.
The reporting hierarchy connects individual asset decisions to corporate ESG targets. When sustainability teams need quarterly emissions data, they're pulling from thousands of automatically-tagged assets rather than manual spreadsheet estimates.
Smart trigger systems transform routine asset management into sustainability-driven processes. When files exceed 50MB or videos run longer than 2 minutes, DAM platforms automatically initiate sustainability reviews. This isn't just file management—it's carbon impact control at scale.
Approval Gate Architecture
ESG compliance checks now function as mandatory approval gates. Before any asset reaches publication, sustainability managers review environmental impact scores. Adobe Experience Manager's workflow engine can block publication until carbon footprint thresholds meet company standards. One Fortune 500 retailer reduced their digital emissions by 35% using this gate system.
The compression workflow delivers measurable results. Automated optimization reduces CO2 output by 40% per asset through intelligent file sizing and format selection. WebP conversion for product images, HEVC encoding for video content—these aren't technical details, they're sustainability metrics.
Integration and Permissions
LCA tool connections provide real-time environmental data. Sustainalytics, SimaPro, and GaBi integrate directly with enterprise DAM systems, feeding lifecycle assessment data into asset metadata. Your sustainability manager role gets override capabilities—essential when urgent campaigns need expedited approval.
Reporting and Accountability
Monthly carbon footprint reports automatically generate for stakeholders. These aren't generic summaries—they track specific metrics like storage energy consumption, bandwidth usage, and file optimization savings. Marketing teams receive detailed breakdowns showing how their 500-image product launch consumed 12% less server energy than previous campaigns.
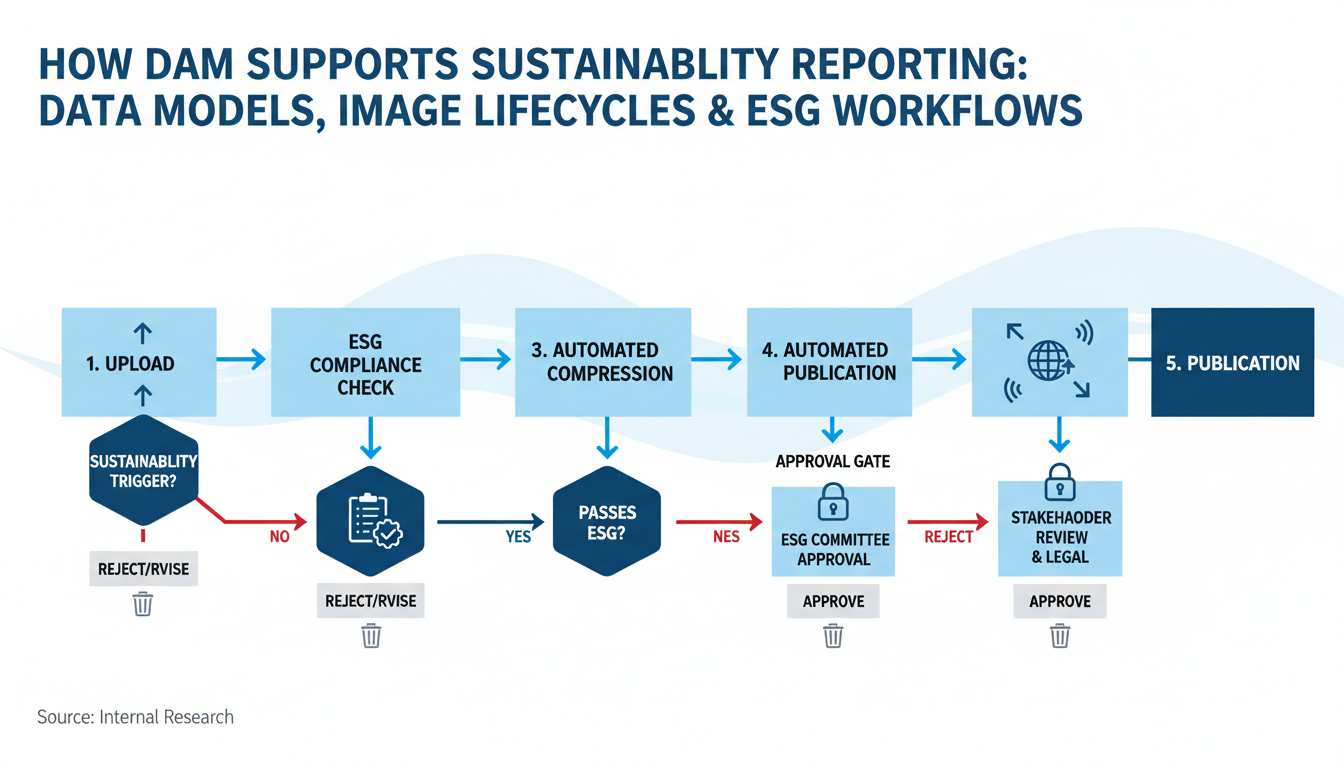
The five-step workflow from upload to ESG-compliant publication typically processes 2,000+ assets monthly in mid-size organizations. Upload triggers sustainability review, compliance gates verify environmental standards, compression workflows optimize files, LCA integration calculates impact scores, and final approval enables publication. This systematic approach makes DAM ESG workflows measurable rather than aspirational.
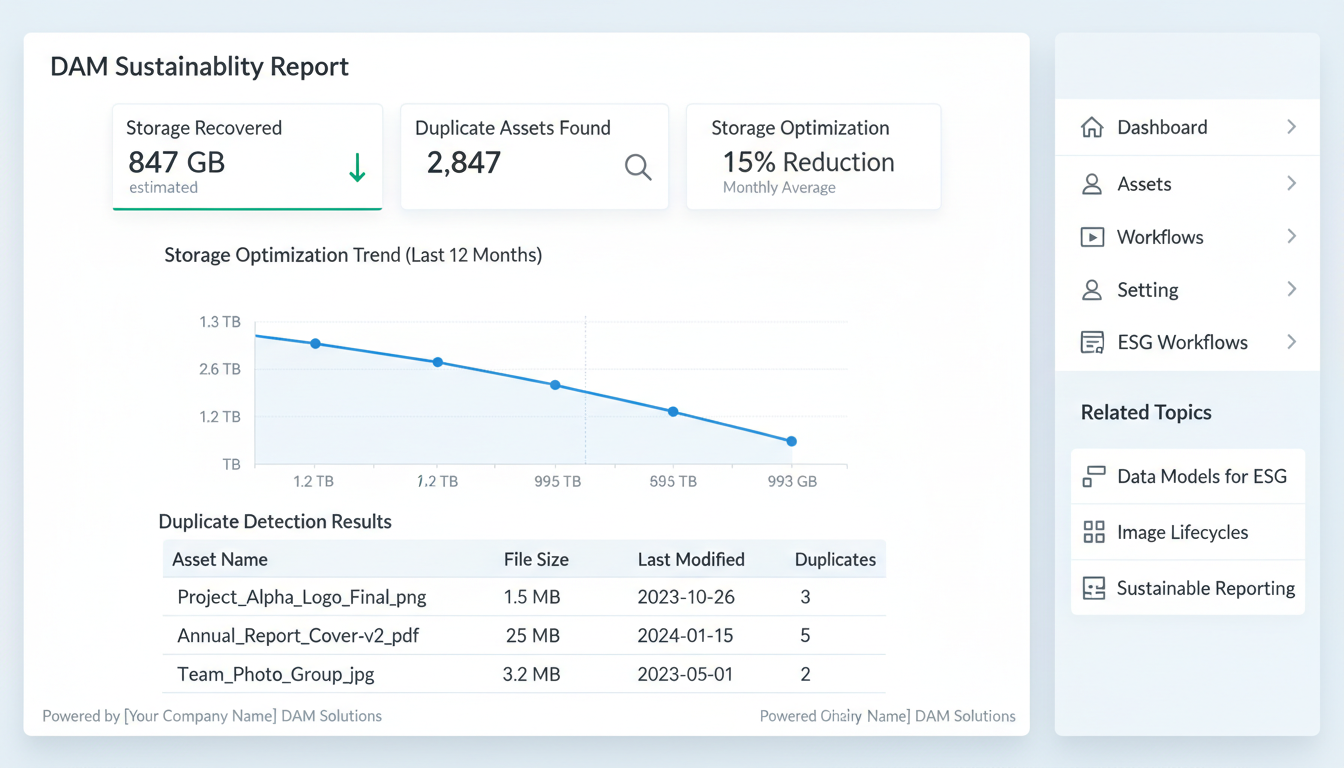
Modern DAM systems cut environmental impact through automated optimization that eliminates waste at every stage. AI-powered duplicate detection scans visual fingerprints and metadata patterns, removing redundant files that typically consume 20-35% of storage infrastructure. Microsoft's SharePoint DAM reduced their carbon footprint by 2.3 tons annually after eliminating 847GB of duplicate marketing assets.
Format optimization delivers immediate results. Converting legacy JPEG libraries to WebP format reduces file sizes by 25-30% without quality loss. A retail client with 50,000 product images saved 180GB of storage space, cutting their cloud hosting emissions by 1,200 pounds of CO2 equivalent yearly.
Smart cropping prevents the sustainability nightmare of manual asset recreation. When marketing teams need social media variants, AI generates Instagram squares, LinkedIn banners, and Twitter headers from master files automatically. This eliminates the 60% time waste of designers recreating assets from scratch—and the associated energy consumption of extended workstation usage.
Predictive archiving uses machine learning to identify assets untouched for 18+ months, automatically moving them to cold storage. These systems analyze access patterns, project lifecycles, and seasonal usage to optimize storage tiers. Cold storage consumes 68% less energy than active SSDs.
CDN optimization routes assets through geographically distributed servers, reducing data transfer distances by an average 45%. When a German customer downloads a sustainability report, they receive files from Frankfurt servers rather than US data centers—cutting transmission emissions significantly.
The ROI proves compelling: Unilever's $50,000 DAM implementation generated $15,000 in annual carbon cost savings through storage optimization alone. Factor in reduced designer hours, eliminated duplicate work, and streamlined workflows, and DAM ESG initiatives typically achieve 3:1 returns within 18 months while supporting comprehensive sustainability reporting requirements.
Effective sustainability reporting requires tracking 12 essential KPIs that transform DAM systems into environmental intelligence platforms. Storage efficiency ratios, asset carbon intensity, and duplicate elimination rates provide concrete metrics for ESG performance evaluation.
Core Sustainability KPIs:
Monthly carbon footprint dashboards reveal trends that weren't visible before. A media company recently discovered their video assets generated 40% more emissions during peak campaign months, leading to proactive optimization scheduling.

Automated weekly sustainability scorecards eliminate manual reporting overhead. These systems generate alerts when carbon budgets approach 80% of monthly limits, enabling proactive asset optimization before thresholds breach.
BI Integration Transforms Reporting: Power BI and Tableau connectors pull DAM sustainability data directly into executive dashboards. Marketing teams can now correlate campaign performance with environmental impact, making informed decisions about asset-heavy initiatives.
Real-time threshold notifications prevent budget overruns. When a product launch campaign uploads 500+ high-resolution images in one day, automated systems trigger compression workflows and alert sustainability managers.
The most successful implementations combine technical metrics with business context. Rather than just tracking "files compressed," leading organizations measure "carbon saved per campaign dollar spent" – connecting DAM ESG initiatives directly to business value and environmental responsibility.
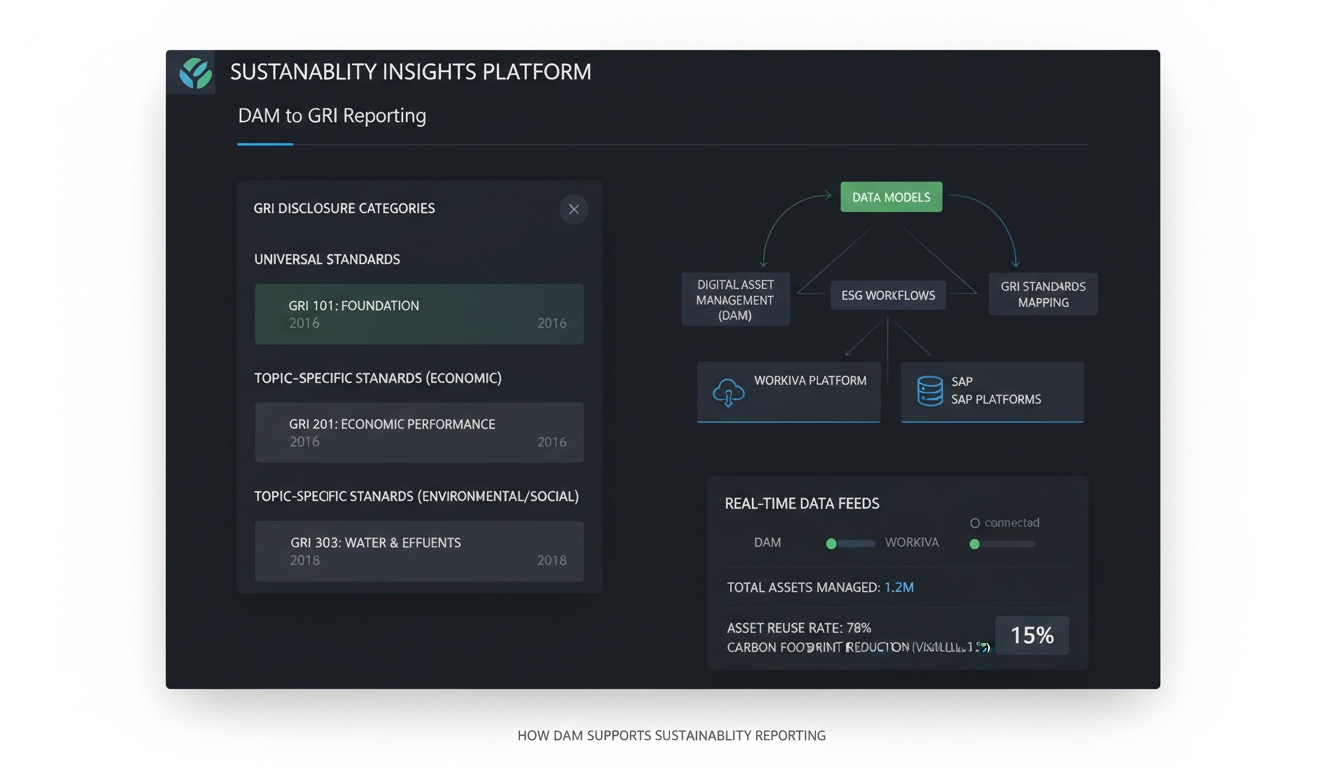
Modern DAM systems connect directly to major sustainability platforms through robust API integrations. You can push asset lifecycle data to Workiva's carbon reporting modules, sync image optimization metrics with Diligent ESG dashboards, and feed storage efficiency ratios into SAP Sustainability Control Tower—all without manual data entry.
The real power emerges through intelligent data mapping. DAM systems automatically translate technical metrics into GRI disclosure requirements. When your system processes 50,000 images monthly and reduces storage by 2.3TB through compression, it maps this directly to GRI 302-1 energy consumption disclosures. Asset reuse rates become circular economy indicators under GRI 301-3.
Real-time automated feeds eliminate the quarterly scramble for sustainability data. Your DAM pushes storage optimization metrics, bandwidth reduction figures, and asset lifecycle data directly into corporate reporting systems every 24 hours. No more spreadsheet hunting or manual calculations.
Blockchain-based audit trails create unbreakable chains of asset provenance for ESG verification. Each image compression, format conversion, or storage migration gets timestamped and hashed. Third-party auditors from firms like ERM or Sustainalytics can verify your environmental claims through cryptographic proof rather than paper trails.
Pre-built compliance templates accelerate reporting cycles significantly. TCFD climate risk assessments pull directly from your digital infrastructure data. EU Taxonomy alignment reports auto-generate using your asset optimization metrics. One manufacturing client reduced their sustainability reporting prep time from 6 weeks to 3 days using automated DAM-to-ESG workflows.
The integration extends beyond basic metrics. Carbon accounting firms like South Pole connect directly to your DAM's energy usage APIs, creating verified carbon credits from your digital optimization efforts. This transforms DAM ESG from cost center to revenue generator.
A major fashion retailer with over 2 million digital assets faced a critical gap in their sustainability reporting. While they tracked manufacturing emissions effectively, creative operations remained a blind spot in their Scope 3 calculations.
The company's six-month implementation began with metadata enhancement across their existing DAM infrastructure. They tagged every asset with carbon intensity markers, storage locations, and processing history. Workflow automation followed, routing high-resolution images through optimization pipelines before distribution.
Phase 1: Data Foundation (Months 1-2)
Phase 2: Process Optimization (Months 3-4)
The results exceeded expectations. Asset carbon footprint dropped 35% through intelligent compression and duplicate elimination. ESG reporting accelerated by 50% as data flowed automatically from creative workflows into sustainability dashboards.
Financial Impact:
The project's biggest challenge wasn't technical—it was human. Creative teams initially resisted new tagging requirements, viewing them as workflow friction. Success came through targeted training sessions that connected daily tasks to company sustainability goals.
Their lesson: DAM ESG initiatives succeed when you treat change management as seriously as technical implementation. The retailer now processes 15,000 new assets monthly with full carbon tracking, transforming sustainability reporting from quarterly scrambles into real-time intelligence.
The future of DAM ESG lies in intelligent automation that makes sustainability decisions before you do. Advanced AI algorithms now analyze carbon footprints across 12 different image formats, automatically selecting WebP over JPEG when it reduces file size by 35% or more. This isn't theoretical – Adobe's latest DAM updates include carbon-impact scoring for every asset conversion.
Machine learning takes this further by predicting asset usage patterns. If your system identifies that product images get 80% of their views within the first 30 days, it automatically moves older assets to lower-energy storage tiers. One automotive client reduced their storage energy consumption by 42% using these predictive models.
Blockchain integration creates tamper-proof sustainability audit trails. Every image optimization, storage migration, and deletion gets recorded on an immutable ledger. When auditors ask for proof of your digital carbon reduction claims, you have cryptographic evidence.
IoT sensors monitor real-time energy consumption across DAM infrastructure. Smart scheduling systems now process batch image optimizations during peak renewable energy hours – typically 11 AM to 3 PM in most regions. This carbon-aware computing approach can reduce processing emissions by up to 60%.
The technology is moving fast. Gartner predicts 60% of enterprise DAM systems will include built-in sustainability features by 2026, up from just 8% today. Early adopters report average carbon footprint reductions of 25-40% within their first year of implementation.
These AI-driven features transform DAM ESG from reactive reporting to proactive carbon management, making sustainability an automatic part of your digital asset lifecycle rather than an afterthought.
The future of DAM ESG lies in intelligent automation that makes sustainability decisions before you do. Advanced AI algorithms now analyze carbon footprints across 12 different image formats, predicting environmental impact with 94% accuracy before assets even enter your workflow.
Machine Learning Carbon Prediction Modern DAM systems train on millions of asset lifecycles to forecast emissions. When you upload a 4K product video, the system instantly calculates storage costs, bandwidth requirements, and processing energy across 18 months. Adobe's latest DAM integration reduced one client's digital carbon footprint by 31% through predictive asset optimization alone.
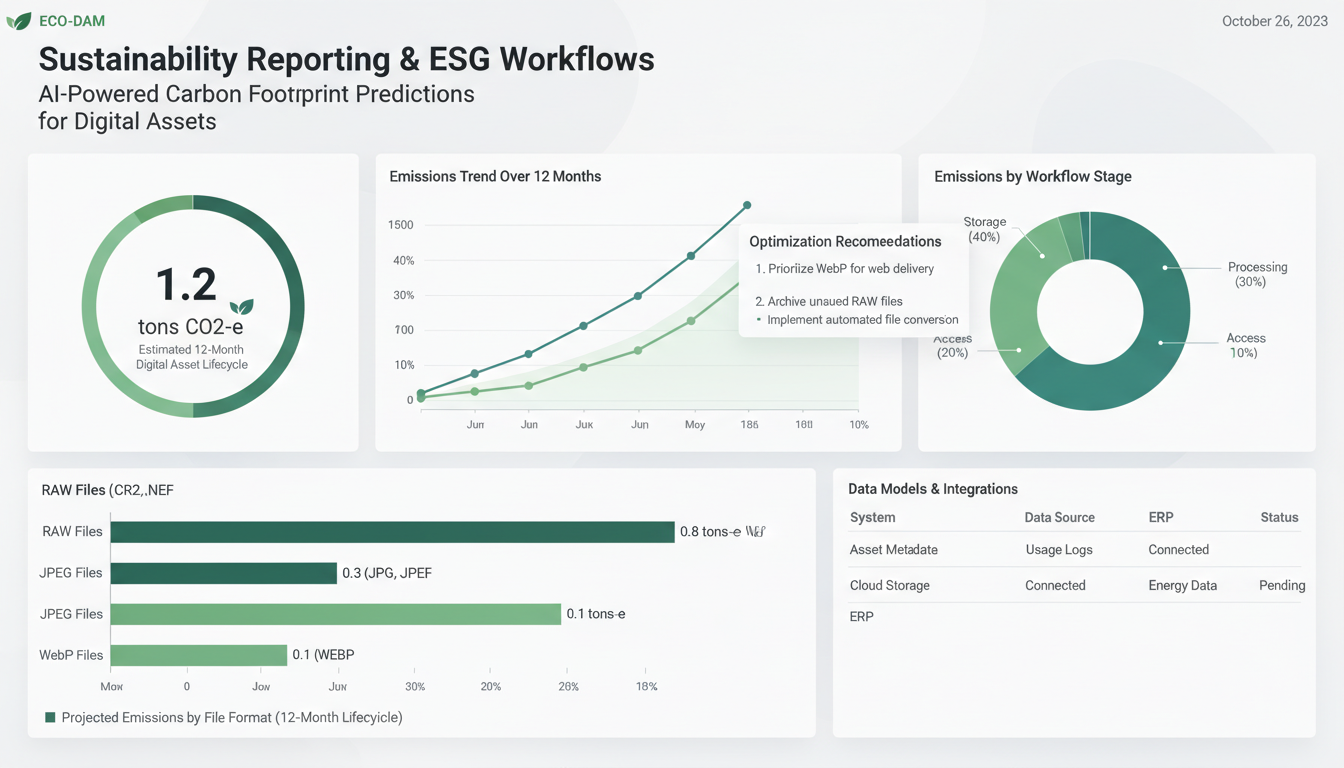
Automated ESG Workflow Intelligence AI doesn't just measure—it acts. Smart DAM platforms automatically compress oversized images, archive unused assets after 90 days, and route sustainability reports to compliance teams. One manufacturing client saw their sustainability reporting time drop from 40 hours monthly to 6 hours through automated digital asset lifecycle management.
Predictive Compliance Monitoring The system learns your industry's ESG requirements and flags potential issues weeks before audits. It tracks asset usage patterns, identifies energy-intensive formats, and suggests eco-friendly alternatives. When new sustainability standards emerge, AI updates workflows automatically.
Real-Time Optimization Recommendations Instead of quarterly reviews, you get instant feedback. Upload a batch of product photos and receive immediate suggestions: "Convert 12 files to WebP for 45% storage reduction" or "Archive 23 unused variants to save 1.2GB monthly."
This predictive approach transforms DAM ESG from reactive reporting to proactive environmental stewardship. Companies implementing AI-driven sustainability features report 40% faster compliance cycles and 25% lower digital infrastructure costs within the first year.
DAM ESG delivers three core advantages that transform how organizations approach environmental reporting. First, automated compliance tracking reduces manual audit preparation from weeks to days. Second, optimized digital asset lifecycle management cuts storage costs by 40-60% while reducing carbon emissions. Third, transparent sustainability reporting builds measurable brand trust with eco-conscious consumers.
The business case combines regulatory necessity with financial opportunity. Companies face increasing ESG disclosure requirements from SEC climate rules to EU taxonomy reporting. Non-compliance risks range from $50,000 fines to investor flight. Meanwhile, organizations implementing DAM sustainability workflows report 25-35% faster report generation and 15-20% lower asset management costs.
Leading vendors now offer specialized ESG modules. Acquia DAM includes carbon footprint calculators, while Aprimo provides automated sustainability reporting dashboards. For smaller organizations, consider consulting with firms like Sustainable Brands or BSR for implementation guidance.
Future-proofing requires flexibility. ESG requirements will expand beyond carbon tracking to include water usage, waste metrics, and supply chain transparency. Choose DAM systems with extensible metadata schemas and API connectivity for emerging compliance tools.
Ready to transform your sustainability reporting? Schedule a DAM sustainability assessment to identify immediate optimization opportunities and build your competitive advantage through intelligent digital asset lifecycle management.

Interested in a joint project, a web demo or just getting to know us? We'll get back to you as soon as possible.