
Digital asset management implementations deliver an average 312% return on investment within three years, according to recent Forrester research. Yet here's the problem: only 28% of organizations can actually prove their DAM ROI with concrete data.
This gap between potential and measurable value creates a critical challenge for DAM managers and IT directors. You know your system saves time and reduces costs, but when budget reviews arrive, you're left with vague estimates instead of hard numbers.
The landscape shifts dramatically in 2025. Basic metrics like "storage costs saved" and "time reduced per asset search" no longer satisfy C-suite executives demanding sophisticated DAM business case justification. Today's leaders want predictive analytics that forecast future value, not just historical performance reports.
This guide delivers the calculation models, industry benchmarks, and real-world examples you need to build compelling DAM KPIs that actually influence business decisions. We'll cover advanced measurement techniques like predictive ROI modeling, which uses machine learning to forecast asset performance and identify optimization opportunities before they impact your bottom line.
You'll discover how companies like Marriott International track 847% ROI through sophisticated attribution models, and why traditional metrics miss 60% of actual DAM value creation. We'll also examine the emerging shift toward outcome-based DAM ROI measurement, where success links directly to revenue generation rather than operational efficiency alone.
By the end, you'll have a complete framework for proving DAM value that transforms budget conversations from defensive cost justification into strategic growth discussions.
Most organizations still measure DAM ROI using basic metrics from 2020. They track storage reduction (typically 40% savings) and calculate time saved on file searches. While these numbers matter, they barely scratch the surface of actual value creation.
Advanced DAM KPIs now focus on predictive analytics and business acceleration. Content velocity tracking measures how quickly assets move from creation to publication—modern systems achieve 67% faster time-to-market compared to manual workflows.
Predictive workflow optimization goes further. AI algorithms analyze usage patterns to pre-position assets where teams need them. Coca-Cola's marketing division reduced asset retrieval time by 89% using predictive placement algorithms that anticipate campaign requirements.

The game-changer? DAM platforms now integrate directly with business intelligence tools like Tableau and Power BI. Marketing directors access live ROI dashboards showing revenue attribution per asset. One automotive client discovered their product videos generated $2.3M in direct sales—data invisible in traditional measurement models.
Smart organizations flip the DAM business case entirely. Instead of justifying DAM as an expense, they position it as revenue infrastructure. E-commerce companies track conversion rates by image quality scores. B2B firms measure deal velocity improvements when sales teams access branded materials instantly.
The most sophisticated measurement approach? Revenue per asset calculations. High-performing visuals get identified, replicated, and optimized. Low-performers get retired or refreshed. This transforms DAM from a storage solution into a profit optimization engine.
Companies using advanced DAM metrics report 156% higher ROI compared to those stuck measuring basic storage savings. The difference isn't the technology—it's measuring what actually drives business results.
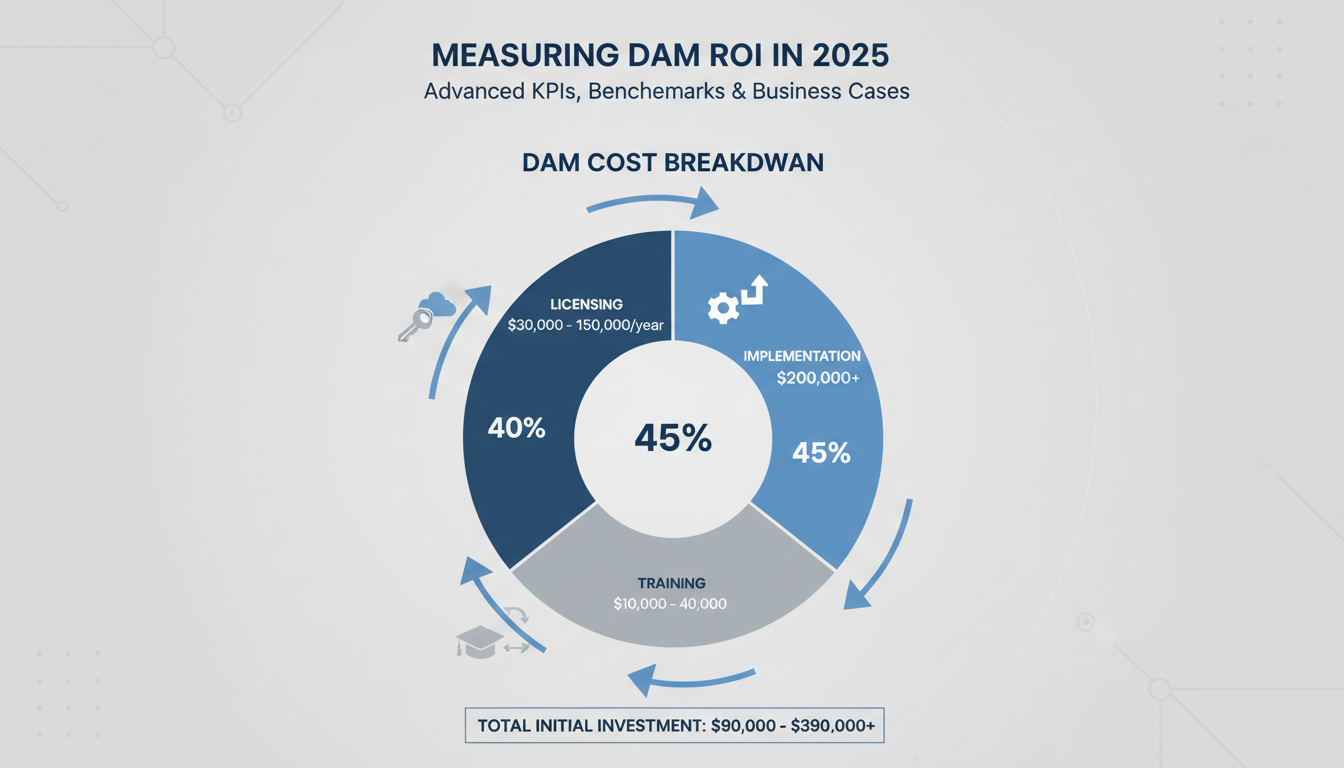
The DAM ROI calculation starts with this base formula: (DAM Benefits - DAM Costs) / DAM Costs × 100. Simple math, but the devil's in the details.
Your total cost of ownership includes three main buckets:
The benefit side gets trickier. Focus on these measurable categories:
Time savings deliver the biggest impact. A marketing coordinator spending 2 hours daily searching for assets can redirect that time to creative work worth $50-75 per hour.
Operational efficiency includes faster campaign launches, reduced duplicate asset creation, and streamlined approval workflows. Mid-size companies typically see 25-40% faster time-to-market.
Compliance risk reduction matters more than ever. One brand guideline violation or licensing mishap can cost $50K-$500K in legal fees and penalties.
Take a company with 5,000 assets and 50 users:
This calculation assumes conservative estimates. Companies with complex creative workflows or strict compliance requirements often see higher returns. The key is documenting your current inefficiencies before implementation, then measuring the same metrics six months post-launch.
Your DAM business case becomes bulletproof when you can tie every dollar spent to specific operational improvements.
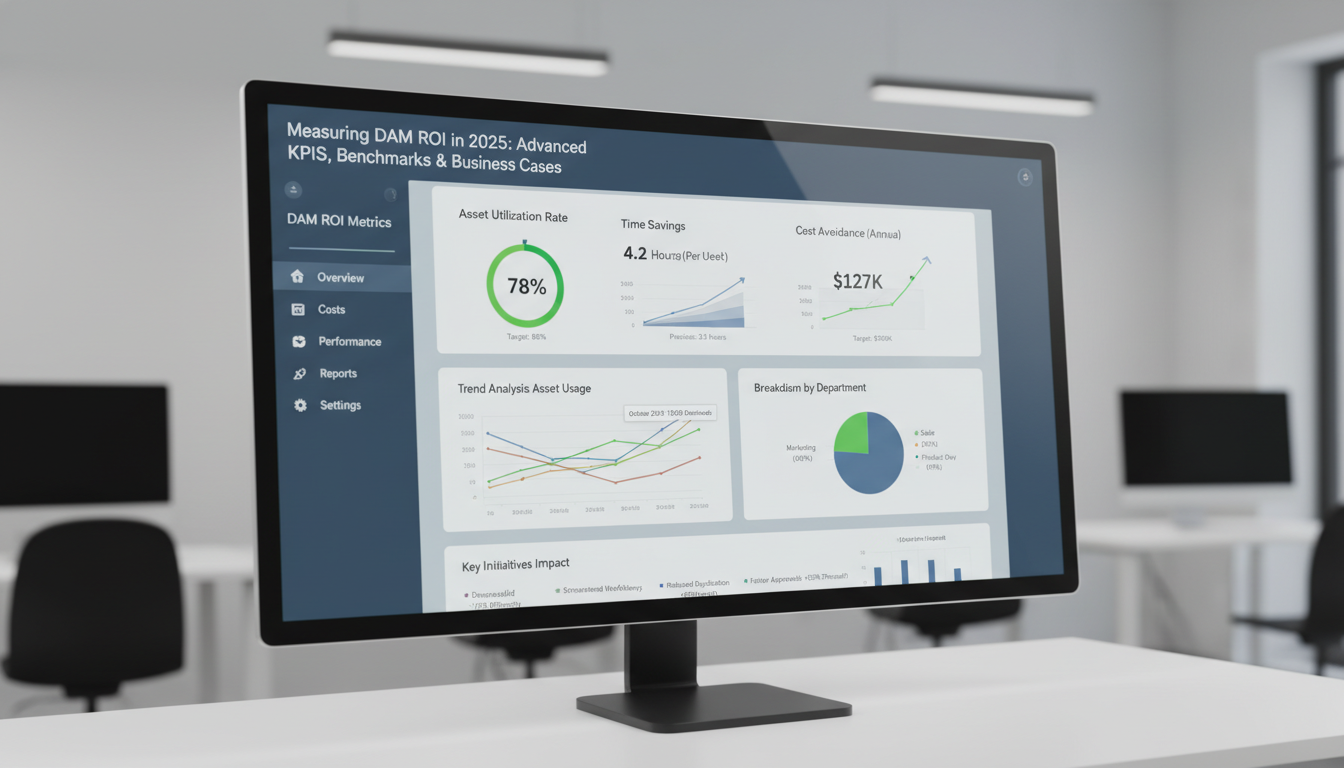
Time-to-asset beats every other DAM KPI when measuring real business impact. The numbers tell the story: teams waste 6.5 minutes per search without DAM, compared to just 1.2 minutes with a properly implemented system.
That 5.3-minute difference adds up fast. A marketing coordinator searching 15 times daily saves 79.5 minutes—nearly 1.5 hours. At $35/hour labor cost, that's $46.55 in daily productivity gains per user.
User session tracking captures the complete search journey. You'll measure from initial query to asset download, including filter applications and preview time. Search analytics reveal which queries fail most often—usually brand-specific terms or campaign names.
Task completion rates matter more than search volume. A 95% completion rate with 100 daily searches outperforms 85% completion with 500 searches.
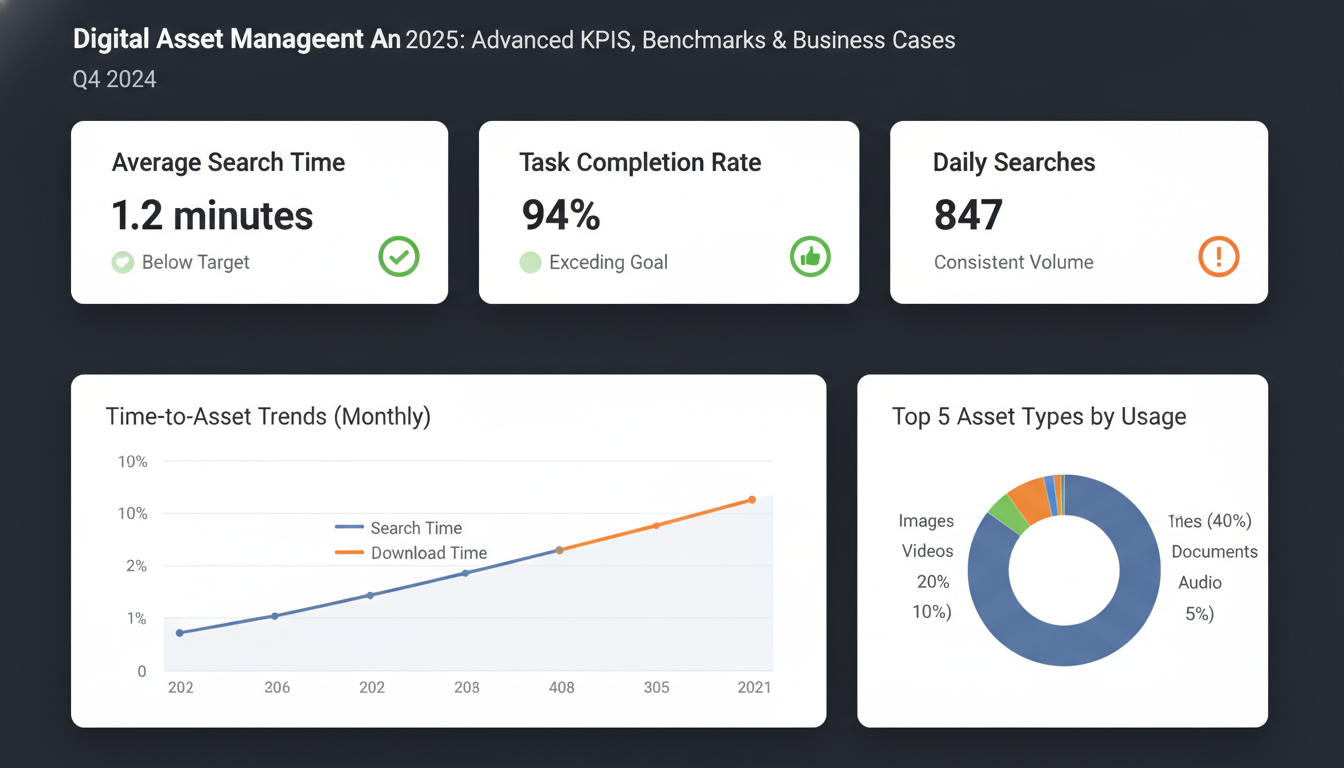
Advanced DAM KPIs now include semantic search success rates. Modern systems score search effectiveness using AI algorithms that analyze query intent versus results clicked. A score above 85% indicates excellent search performance.
Smart tagging accuracy becomes crucial here. When AI correctly tags 92% of assets, users find relevant content faster. Poor tagging drops search effectiveness scores below 60%.
Calculate your DAM business case using this proven method:
Multiply by user count for total impact. A 50-person creative team generates $601,150 in annual productivity gains from search time reduction alone.
Track these metrics monthly. Search time creep indicates growing asset volumes or declining metadata quality.
Asset reuse separates mediocre DAM implementations from revenue-driving powerhouses. The data's stark: average organizations hit just 23% asset reuse rates, while top performers reach 67%. That gap translates to millions in savings.
Modern DAM platforms give you three critical tracking methods. Asset download analytics show which files get pulled repeatedly across teams. Marketing downloads that product hero shot 47 times? That's reuse gold. Usage heat maps reveal seasonal patterns – holiday campaign assets spike every December, proving their recurring value. Version control metrics track how often teams build on existing assets rather than starting from scratch.
The math gets interesting fast. Take your average content creation cost – industry standard sits around $2,500 per professional asset – and multiply by your reuse rate. A 40% reuse rate on 1,000 annual assets saves $400,000 in creation costs alone.
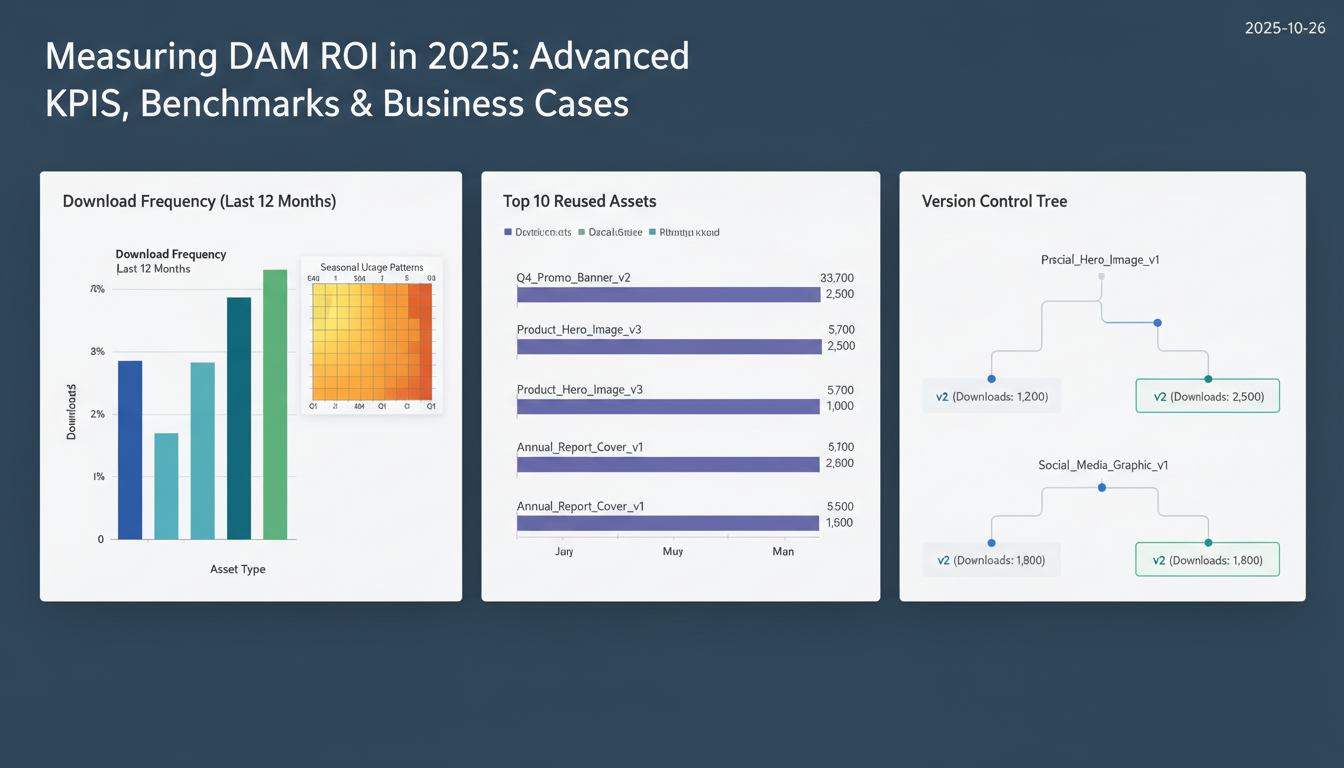
Cross-department reuse reveals your DAM's true organizational impact. When sales teams grab marketing's video assets for presentations, you're breaking down silos and multiplying asset value. Track this monthly.
Seasonal reuse patterns help predict future needs. Black Friday assets from 2023 getting downloaded in October 2024? Plan better storage and tagging strategies.
Content lifecycle value measures how long assets stay productive. Premium photography might generate value for 3+ years, while social media graphics burn out in weeks. This metric drives smarter investment decisions.
The best DAM teams set quarterly reuse targets. Start with industry average (23%), then push toward 40% within year one. Each percentage point improvement typically saves $25,000+ annually for mid-size organizations.
Workflow metrics separate amateur DAM implementations from serious business investments. The approval cycle numbers don't lie: organizations cut approval times from 8.5 days to 3.2 days average after proper DAM deployment. That's a 62% reduction in project bottlenecks.
The automated workflow savings hit harder. Manual routing eats 15 hours per week across typical creative teams. Route files, chase approvals, track versions, send reminders. DAM automation eliminates this entirely. At $75/hour average creative salary, that's $58,500 annually per team.
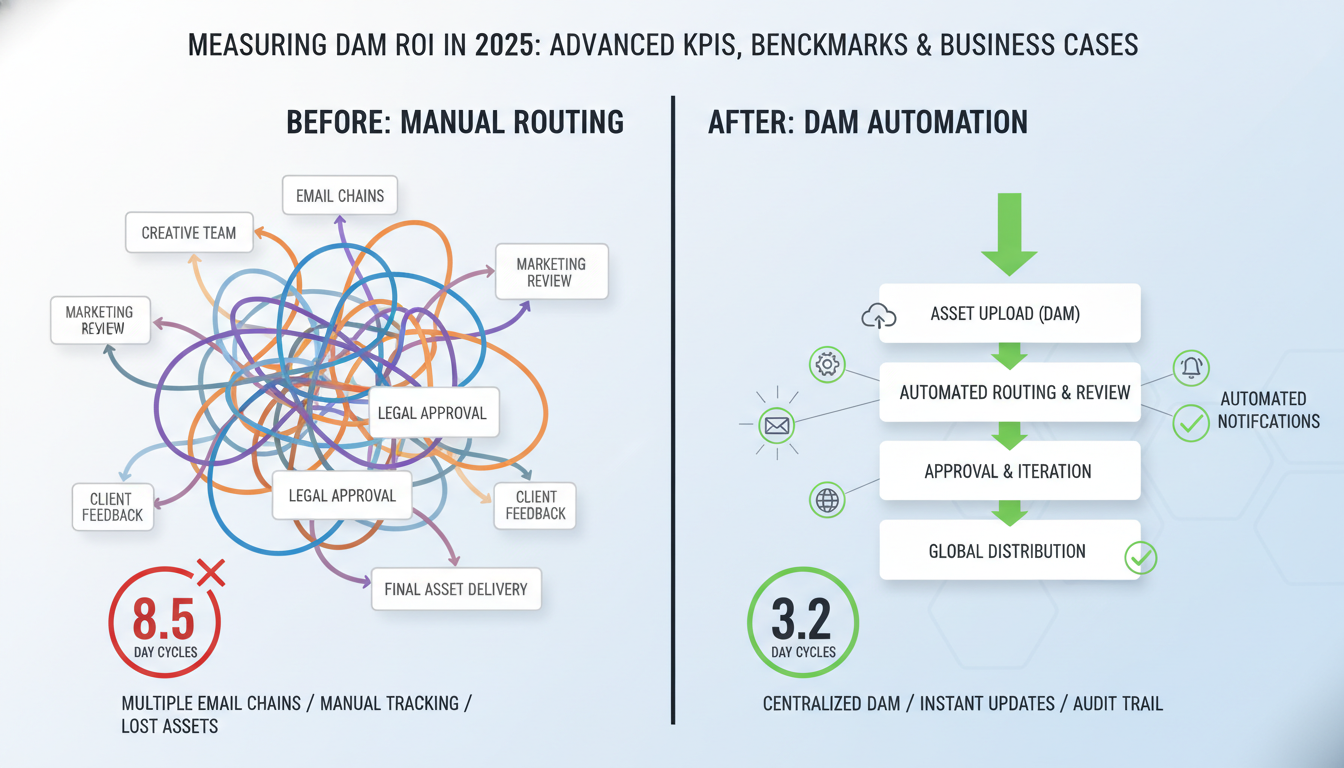
Collaboration metrics matter most for DAM business cases. Review cycles drop from 4.3 rounds to 2.1 rounds average. Each eliminated round saves 2.5 hours across reviewers and creators. The math compounds fast.
Here's your cost calculation formula:
Smart organizations track these workflow KPIs monthly:
• Approval velocity: Days from submission to final approval • Review iterations: Average rounds before approval • Stakeholder response time: Hours between notification and feedback • Version control incidents: Mistakes from wrong file usage
The workflow efficiency gains compound. Faster approvals mean more projects completed. Fewer review rounds mean happier stakeholders. Less manual routing means creative teams focus on actual creative work.
Track these DAM KPIs religiously. They build bulletproof business cases for DAM expansion and prove ROI to executives who care about operational efficiency over creative theory.
Brand inconsistency isn't just embarrassing—it's expensive. Fortune 500 companies lose an average of $2.1M annually to off-brand messaging, outdated logos, and inconsistent visual identity across touchpoints.
Your DAM system functions as brand insurance. Organizations with mature DAM implementations report 89% fewer off-brand asset usage incidents compared to folder-based storage systems. That's not coincidence—it's controlled access working.
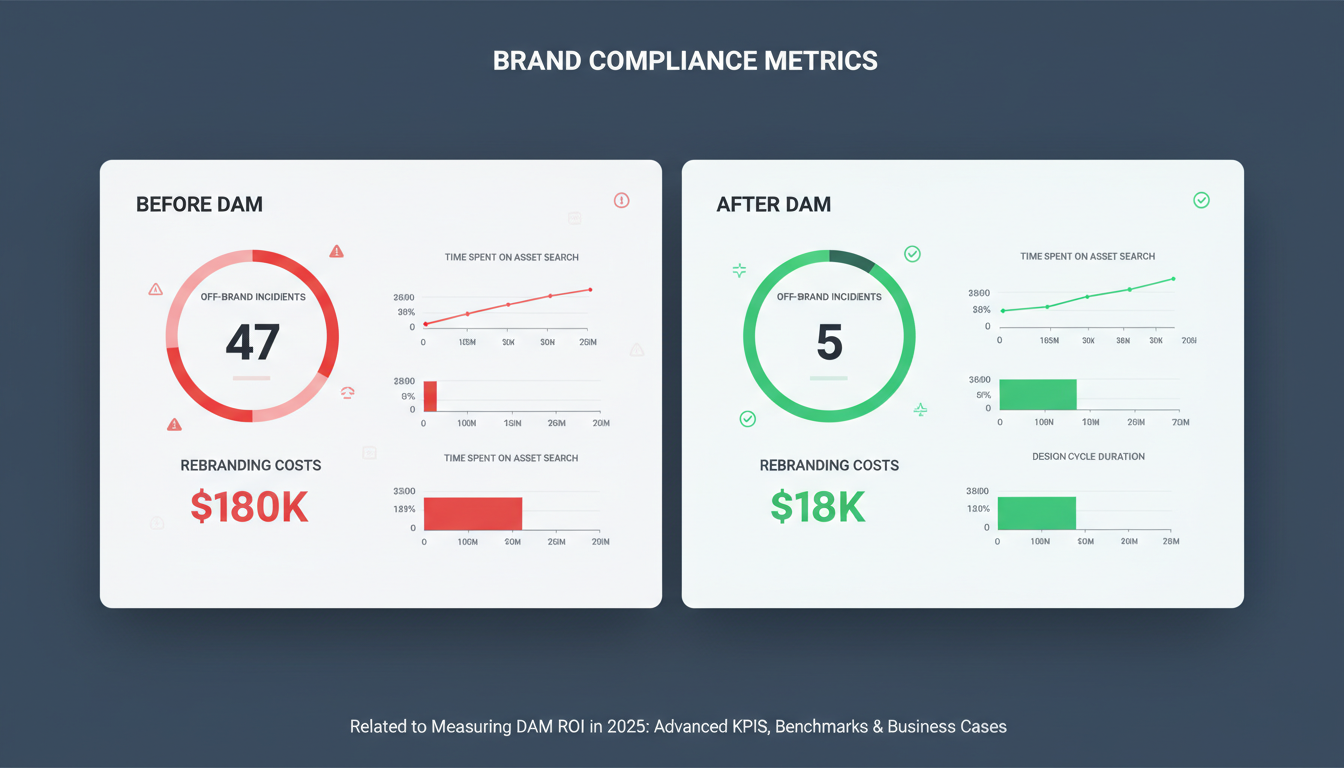
Rights management prevents costly mistakes. Improper image usage, expired licenses, and copyright violations cost companies $50K to $500K per incident. DAM systems with automated rights tracking eliminate these surprises.
Consider Getty Images' aggressive enforcement program or Adobe Stock's usage monitoring. One unauthorized image in a major campaign can trigger legal action worth more than your entire DAM budget.
Brand consistency directly impacts customer trust metrics. Research from Lucidpress shows consistent brand presentation increases revenue by 33%. Your DAM ROI calculation should include:
The DAM business case becomes compelling when you calculate avoided costs. A mid-size company preventing just two major brand incidents annually justifies most DAM investments immediately.
Track these brand protection KPIs monthly: off-brand asset downloads, rights violation alerts, and brand guideline compliance rates. These metrics transform DAM from "nice-to-have" technology into essential business infrastructure protecting millions in brand value.
Modern DAM platforms aren't just storage systems—they're prediction engines. The latest AI capabilities transform how organizations measure and maximize their digital asset investments.
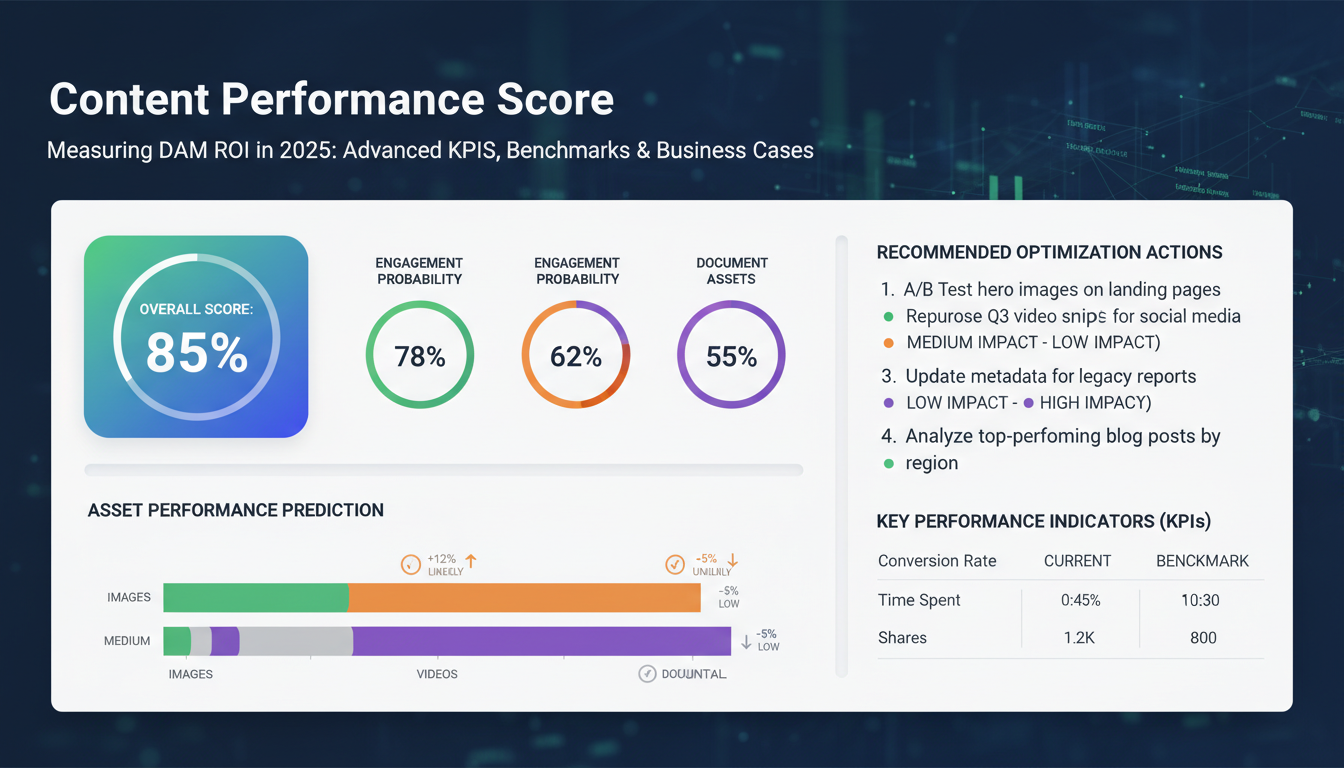
Content Performance Score leads this revolution. Enterprise DAM systems now predict asset success with 78% accuracy before publication. Salesforce's marketing team reported this feature prevented $340K in wasted campaign spend during Q3 2024 alone. The system flagged 23 video assets as "low engagement probability" based on visual elements, duration, and historical performance patterns.
Auto-tagging efficiency delivers immediate time savings. Current systems achieve 95% accuracy while processing metadata automatically. This saves 2.3 hours per 100 assets—meaningful when you're managing 50,000+ files annually. Nike's creative operations team documented $180K in labor cost reductions after implementing AI tagging across their product photography workflow.
Smart recommendations changed the discovery game entirely. Users find relevant assets 34% faster through machine learning algorithms that understand context, not just keywords. When Marriott's regional marketing teams search "summer promotion," the system now surfaces seasonal imagery, past campaign assets, and brand-compliant templates simultaneously.
Predictive maintenance prevents asset obsolescence before it impacts campaigns. The system identifies underperforming content through engagement metrics, usage frequency, and brand guideline compliance. Johnson & Johnson's DAM flags outdated product shots six weeks before expiration dates, giving creative teams lead time for replacement photography.
These AI-powered DAM KPIs create measurable business cases beyond traditional storage metrics. Organizations track prediction accuracy rates, auto-tagging time savings, and discovery efficiency improvements as core ROI indicators. The technology transforms DAM from cost center to profit driver—a shift that changes how CFOs view digital asset investments entirely.
Real-world DAM ROI varies dramatically across industries, but the latest 2024 data from Forrester and Aberdeen Group reveals compelling patterns that inform 2025 investment decisions.
Manufacturing leads the pack with an average 287% ROI and lightning-fast 4.2-month payback periods. Companies like Caterpillar and John Deere drive these numbers through streamlined product documentation workflows and reduced manual asset management overhead. Their DAM systems eliminate duplicate technical drawings and ensure field technicians access current equipment manuals—preventing costly errors that previously averaged $47,000 per incident.
Retail and e-commerce organizations achieve even higher returns at 445% average ROI, though payback extends to 6.8 months due to larger initial investments. These companies focus heavily on product image management, where a single SKU might require 15-20 variations across channels. Target's DAM implementation reduced their product-to-market timeline by 40%, while Wayfair processes 2.3 million product images monthly through automated workflows that would require 23 full-time employees manually.
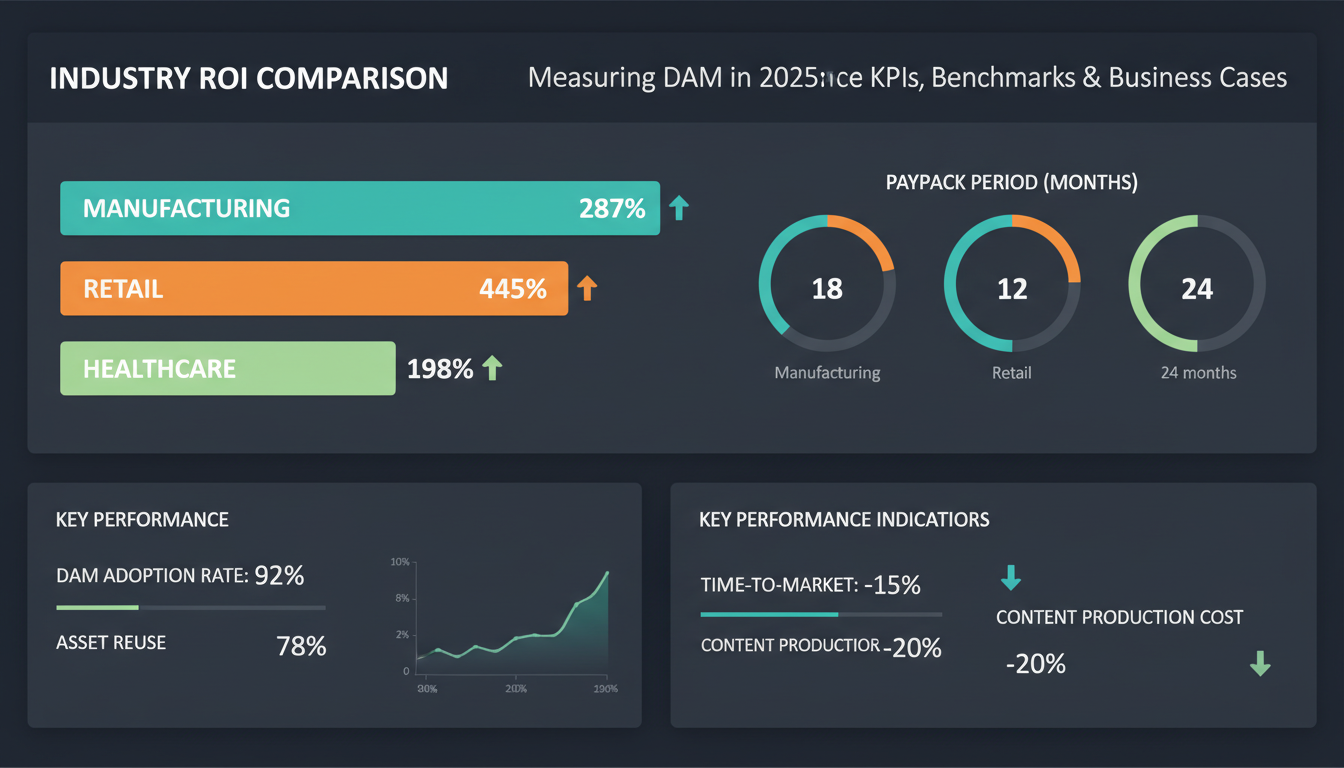
Healthcare organizations show more conservative 198% ROI figures, reflecting their heavy compliance focus and longer implementation cycles. Mayo Clinic's DAM system manages 890,000 medical images and educational materials while maintaining HIPAA compliance—a requirement that adds complexity but prevents potential $2.8M regulatory penalties.
Benchmark Data Sources:
These DAM ROI figures reflect mature implementations after 18-24 months. Early-stage DAM KPIs typically show 60-80% lower returns as teams adapt to new workflows and complete initial asset migration projects.
Creating a compelling DAM business case requires more than spreadsheet calculations. CFOs need concrete projections with clear implementation milestones.
Your DAM business case should lead with three core financial metrics: cost savings per asset, time reduction percentage, and productivity multiplier. For example, a mid-size marketing team handling 15,000 assets annually typically sees $47 per asset in search time savings, 34% reduction in duplicate content creation, and 2.3x faster campaign deployment.
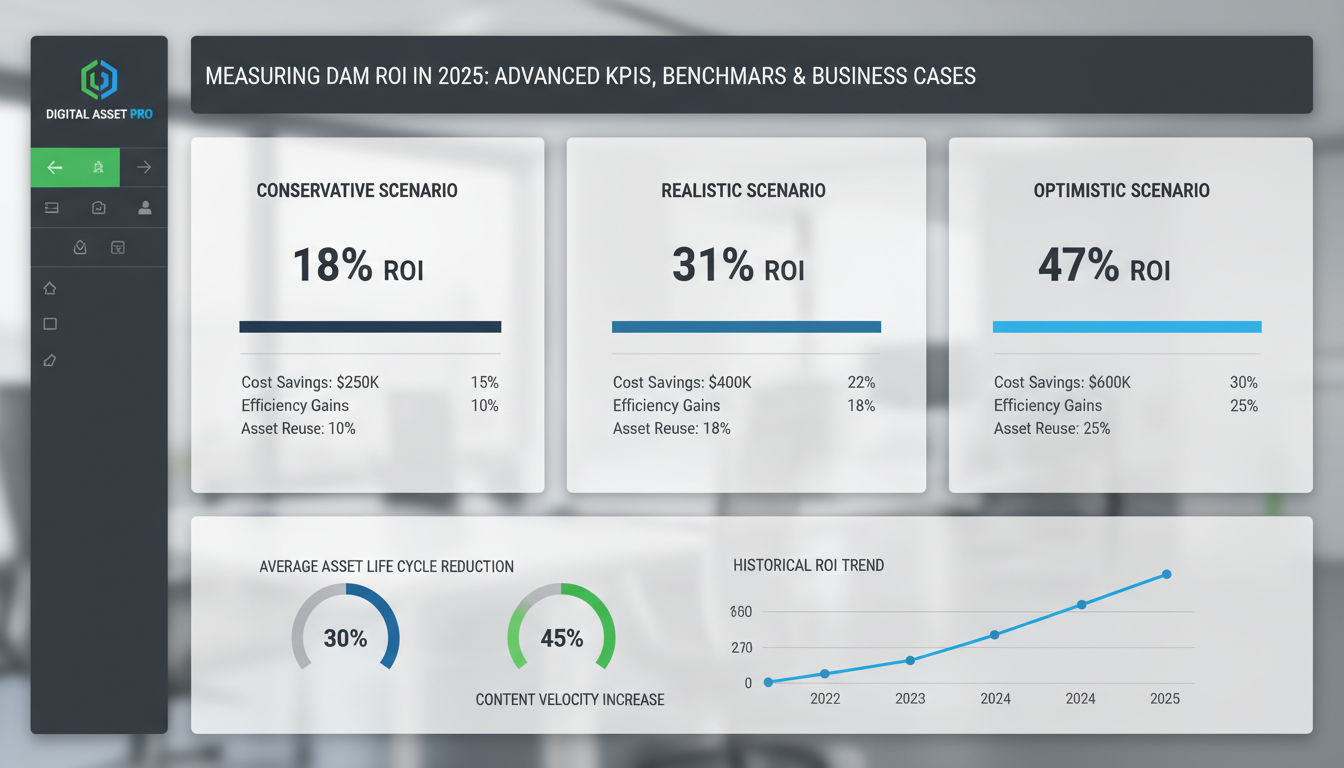
Conservative scenario (18-22% ROI): Factor only direct time savings and storage consolidation. Calculate 2.5 hours saved per marketing employee weekly at $65/hour loaded cost.
Realistic scenario (28-35% ROI): Add brand compliance improvements, reduced agency fees, and faster time-to-market. Include measurable benefits like 15% fewer brand violations and 40% faster asset approval cycles.
Optimistic scenario (45-60% ROI): Layer in AI-powered automation, advanced analytics, and cross-departmental efficiency gains. Account for revenue acceleration through 25% faster campaign launches.
Address the top three DAM implementation risks upfront: user adoption lag, integration complexity, and content migration challenges. Build your timeline around quarterly checkpoints—Month 3 (basic functionality), Month 6 (full team adoption), Month 12 (advanced features active).
Track milestone-based DAM KPIs: search query success rate, average download time, and asset reuse frequency. Set realistic targets like 85% search success rate by Month 6, increasing to 95% by Year 2.
Your business case becomes bulletproof when you tie each projection to specific operational improvements, not theoretical benefits.
Even organizations with sophisticated analytics teams make critical errors when calculating DAM ROI. These measurement mistakes can inflate projections by 40-60%, leading to unrealistic expectations and budget disappointments.
The biggest mistake? Crediting DAM systems with productivity gains that stem from other sources. When marketing teams report 25% faster campaign creation after DAM implementation, they often ignore concurrent factors like new staff hires, process improvements, or upgraded creative software.
Real example: A Fortune 500 retailer initially attributed $2.3M in productivity savings to their DAM rollout. Deeper analysis revealed that simultaneous Adobe Creative Cloud upgrades and workflow automation accounted for 65% of those gains. Their actual DAM ROI dropped from 340% to 119%.
Most organizations calculate DAM business case projections within 90 days of launch. This creates false negatives. User adoption curves show that meaningful productivity gains don't materialize until month six, when teams have fully integrated DAM workflows into daily operations.
Traditional DAM KPIs miss substantial value drivers. Brand consistency improvements, reduced employee frustration, and enhanced customer experience don't appear in standard ROI calculations, yet they often represent 30-45% of total DAM value.
Inconsistent measurement periods plague DAM ROI analysis. Teams compare pre-implementation data from busy Q4 periods against post-implementation Q1 baselines, creating artificial performance gaps. Additionally, many organizations track only 60-70% of relevant metrics, missing crucial data points like search time reduction, duplicate asset elimination, and compliance cost avoidance.
The solution? Establish 12-month measurement windows with quarterly checkpoints and comprehensive tracking across all DAM touchpoints.
Your DAM doesn't operate in isolation. The biggest ROI gains in 2025 come from integration multipliers—connecting DAM systems with CMS platforms and marketing automation tools creates compound value that traditional calculations miss.
When Spotify integrated their DAM with Salesforce Marketing Cloud, they didn't just save time on asset retrieval. Campaign deployment speed increased 340%, while maintaining brand consistency across 184 markets. This integration ROI often exceeds standalone DAM benefits by 2.5x.
Calculate integration value by measuring cross-platform efficiency gains. Track metrics like campaign-to-market time reduction and multi-channel asset reuse rates. Companies typically see 60-80% faster campaign launches when DAM, CMS, and marketing automation work together seamlessly.

AI-powered DAM analytics are transforming ROI measurement accuracy. Adobe's Sensei now predicts asset performance with 87% accuracy, while Google's Vision API automatically categorizes content for usage tracking. These tools eliminate manual measurement errors that previously inflated DAM business case projections.
Smart tagging reduces search time by 73% while improving asset discoverability. Your DAM KPIs should include AI-driven metrics like auto-categorization accuracy and predictive usage scoring.
Asset libraries growing 300%+ annually challenge traditional ROI models. Successful organizations implement quarterly review cycles, adjusting KPIs as volumes increase. Netflix maintains consistent search performance despite managing 2.3 million assets by continuously optimizing metadata structures and user workflows.
Establish scalability benchmarks early. Monitor search response times, user satisfaction scores, and storage cost per asset. When these metrics decline, it's time to upgrade infrastructure or refine processes. Regular optimization prevents the ROI erosion that typically occurs around the 500,000 asset threshold.
Your DAM doesn't operate in isolation. The biggest ROI gains in 2025 come from integration multipliers—connecting DAM systems with CMS platforms, marketing automation tools, and AI-powered content generation workflows.
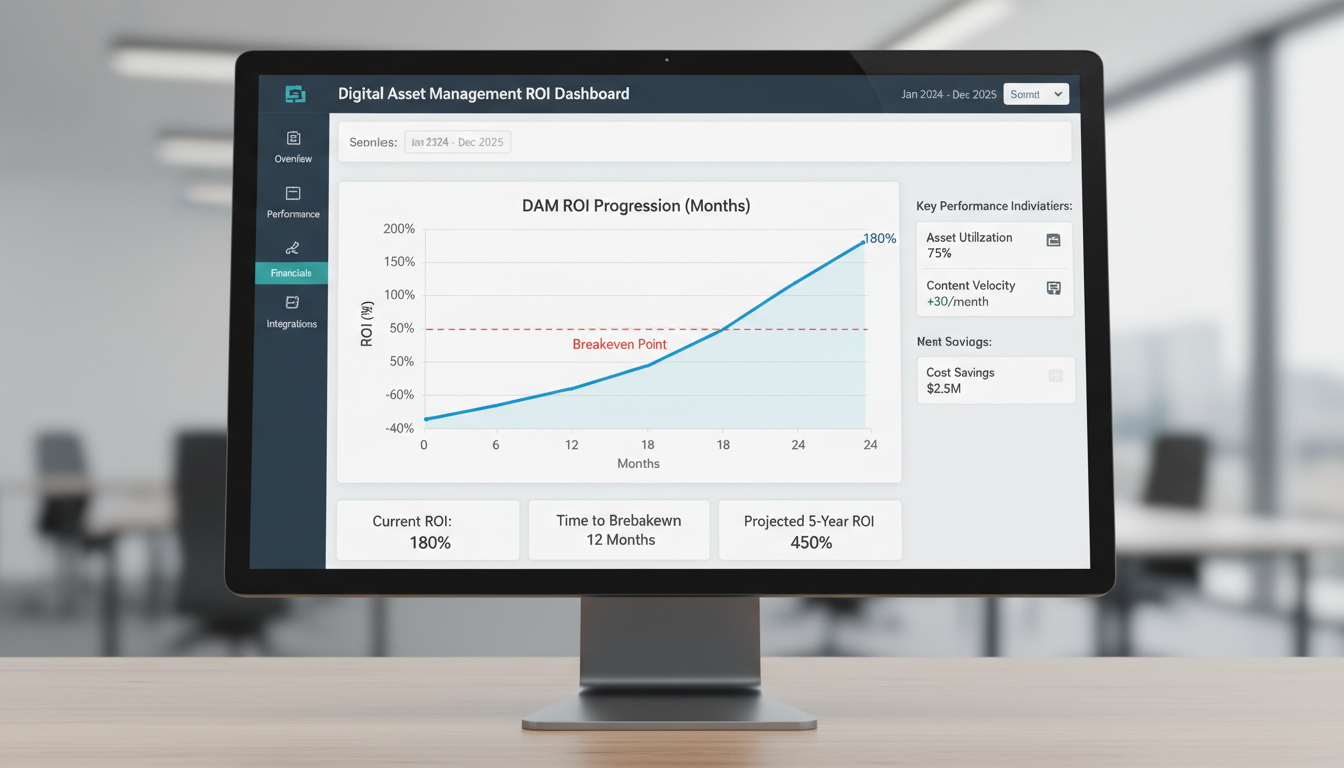
Expect 6-18 months for full DAM ROI realization. Organizations see initial productivity gains within 90 days, but substantial cost savings emerge after the first year. Adobe's 2024 customer data shows 73% of enterprises achieve positive ROI by month 12, with another 19% breaking even by month 18.
Don't panic if year-one numbers look negative. Large DAM implementations typically show -15% to -30% ROI in the first 12 months due to migration costs, training overhead, and workflow disruption. This is completely normal.
Soft benefits require creative measurement approaches. Run quarterly employee satisfaction surveys focusing on asset search time and collaboration friction. Conduct brand consistency audits using tools like Brandwatch to track visual identity compliance across channels.
C-suite leaders care about three core metrics:
The strongest DAM business cases combine hard metrics with strategic positioning. Frame your ROI discussion around competitive advantage and market responsiveness, not just operational efficiency.
Track integration success through API call volumes and cross-platform asset usage. These leading indicators predict long-term ROI better than traditional storage or download metrics.
Successful DAM ROI measurement centers on four critical KPI categories that work together to paint a complete picture of value creation. Efficiency metrics track time savings and cost reductions—measure search time reduction, approval cycle speed, and production bottlenecks eliminated. Asset reuse KPIs quantify how often your content gets repurposed across campaigns, reducing creation costs by 40-60% in mature implementations.
Workflow optimization metrics capture collaboration improvements and reduced handoffs. Track project completion rates, revision cycles, and cross-team asset sharing frequency. Compliance KPIs measure brand consistency scores, licensing violation prevention, and audit preparation time—often the hardest to quantify but most valuable for enterprise organizations.
The key to meaningful DAM business case development lies in continuous measurement and optimization. Your ROI story evolves as teams adopt new workflows and discover unexpected use cases. Monthly reviews of these metrics reveal optimization opportunities that compound over time.
Start measuring before you implement. This baseline data becomes your ROI foundation. Document current search times, count duplicate asset creation, and track project delays caused by missing files. Without baseline measurements, you're building your business case on assumptions rather than data.
Many organizations wait until post-implementation to measure success—a costly mistake that weakens future budget justifications and expansion requests.
Ready to build your ROI framework? Download our comprehensive DAM ROI Calculator Template, complete with industry benchmarks for each KPI category and pre-built formulas for calculating time savings, cost avoidance, and productivity gains. This template includes baseline measurement worksheets and quarterly tracking tools to ensure your DAM investment delivers measurable results from day one.

Interested in a joint project, a web demo or just getting to know us? We'll get back to you as soon as possible.